



Module HR Dashboard
Keep track of the key factors relevant to the management of people and HR processes.
With HR Dashboard) you can collect and view the following in a single interface: Key performance indicators (KPIs) most relevant to people and process management HR. Create custom dashboards by choosing from a wide variety of charts and categories, organise the information into pages and sub-pages, and use advanced and time-based filters to gain a deeper understanding of each phenomenon. Thanks to historical data analysis, you can compare data over time and identify trends and critical areas more quickly.
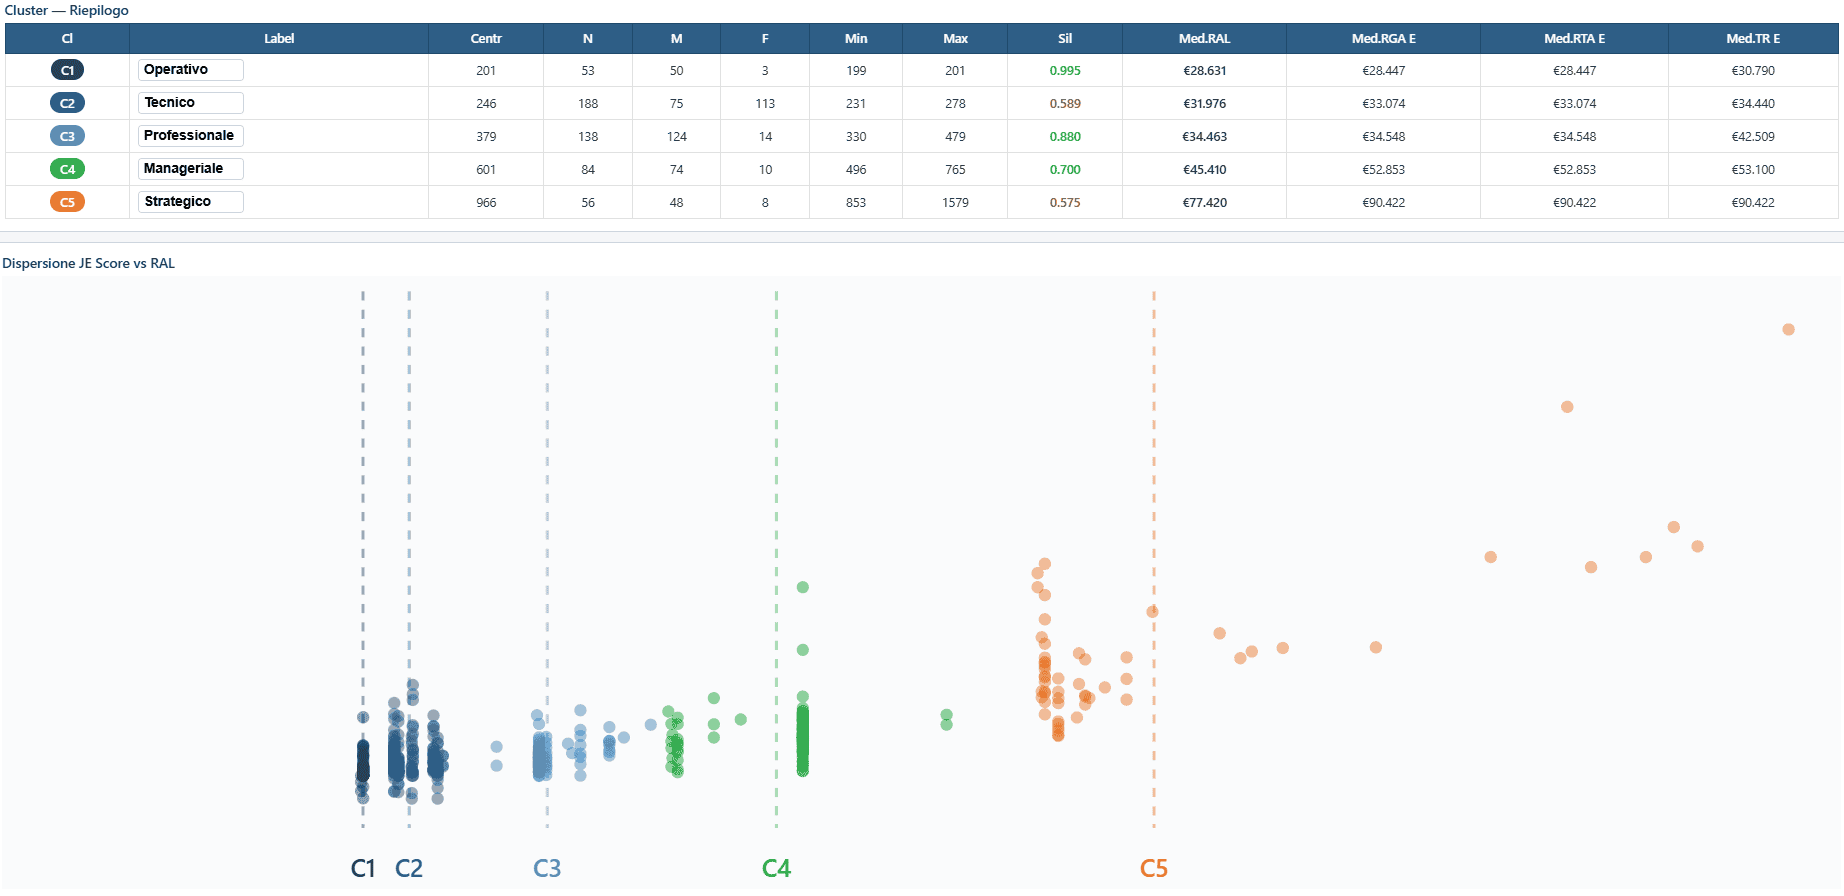
Quickly access up-to-date information, explore the data using interactive dashboards and share it easily using the export and print functions. The ability to analyse, filter and navigate the data dynamically helps to transparency and collaboration, supporting HR and management in identifying insights and making faster, more informed decisions that are consistent with the organisation’s needs.
ANALYSIS AND MONITORING OF THE MOST RELEVANT KPIs
FULL REPORT
View data via advanced interactive graphical dashboards, explore the data and navigate within the dashboards.
IMMEDIATE ACCESS TO DATA
The layout of each dashboard is designed to provide a clear overview of the phenomenon it represents and immediate access to the data.
CUSTOMISING DASHBOARDS
Customise your dashboards based on the KPIs that are most relevant to the company.
MULTIFILTER
Use filters relating to resources and processes to optimise your analyses and uncover new and valuable insights.
TIME FILTERS
Apply time filters to one or more of the available dashboards.
TIME MACHINE
View historical data and navigate effortlessly along the timeline.
EXPORT and PRINT
Group, filter and export data and charts to XLS, CSV, PDF or PNG, or print them directly.
TURN DATA INTO DECISIONS AND VALUE
Benefits
- The transparency
- Encourages collaboration by making it easier to access data
- It supports management decision-making and ensure speed and accuracy
- Access data constantly updated and travel through time
- Monitor the critical areas
- Discover valuable insights
- Improves flexibility and organisational agility
The four-step process
VIEW KEY INFORMATION IMMEDIATELY
View all key metrics using advanced dashboards. Customise your dashboards to suit your needs and choose from a wide range of categories provided by HCMS, or create your own!
